EXECUTIVE SUMMARY
Conducted an exploratory data analysis (EDA) on 1,898 DoorDash orders to identify trends in customer behavior and restaurant performance. The analysis uncovered actionable insights into cuisine popularity, order timing, delivery efficiency, and revenue patterns, providing a data-driven foundation for business optimization strategies.
Goal:
Analyze DoorDash metadata to understand demand trends and customer behavior, informing strategies to improve delivery efficiency and enhance customer experience.
THE CHALLENGE
DoorDash's success depends on operational efficiency and a positive customer experience. Without clear, data-driven insights, the company risks inefficient resource allocation and missed opportunities to improve customer satisfaction and profitability.
MY APPROACH
1. Data Exploration & Cleaning:
- Loaded and inspected the dataset containing 1,898 orders and 9 features.
- Verified data integrity, checking for completeness and confirming no missing values were present.
2. Feature Engineering:
- Created new features, including total_time (combining preparation and delivery) and revenue (based on a commission model), to enable deeper business analysis.
3. Exploratory Data Analysis:
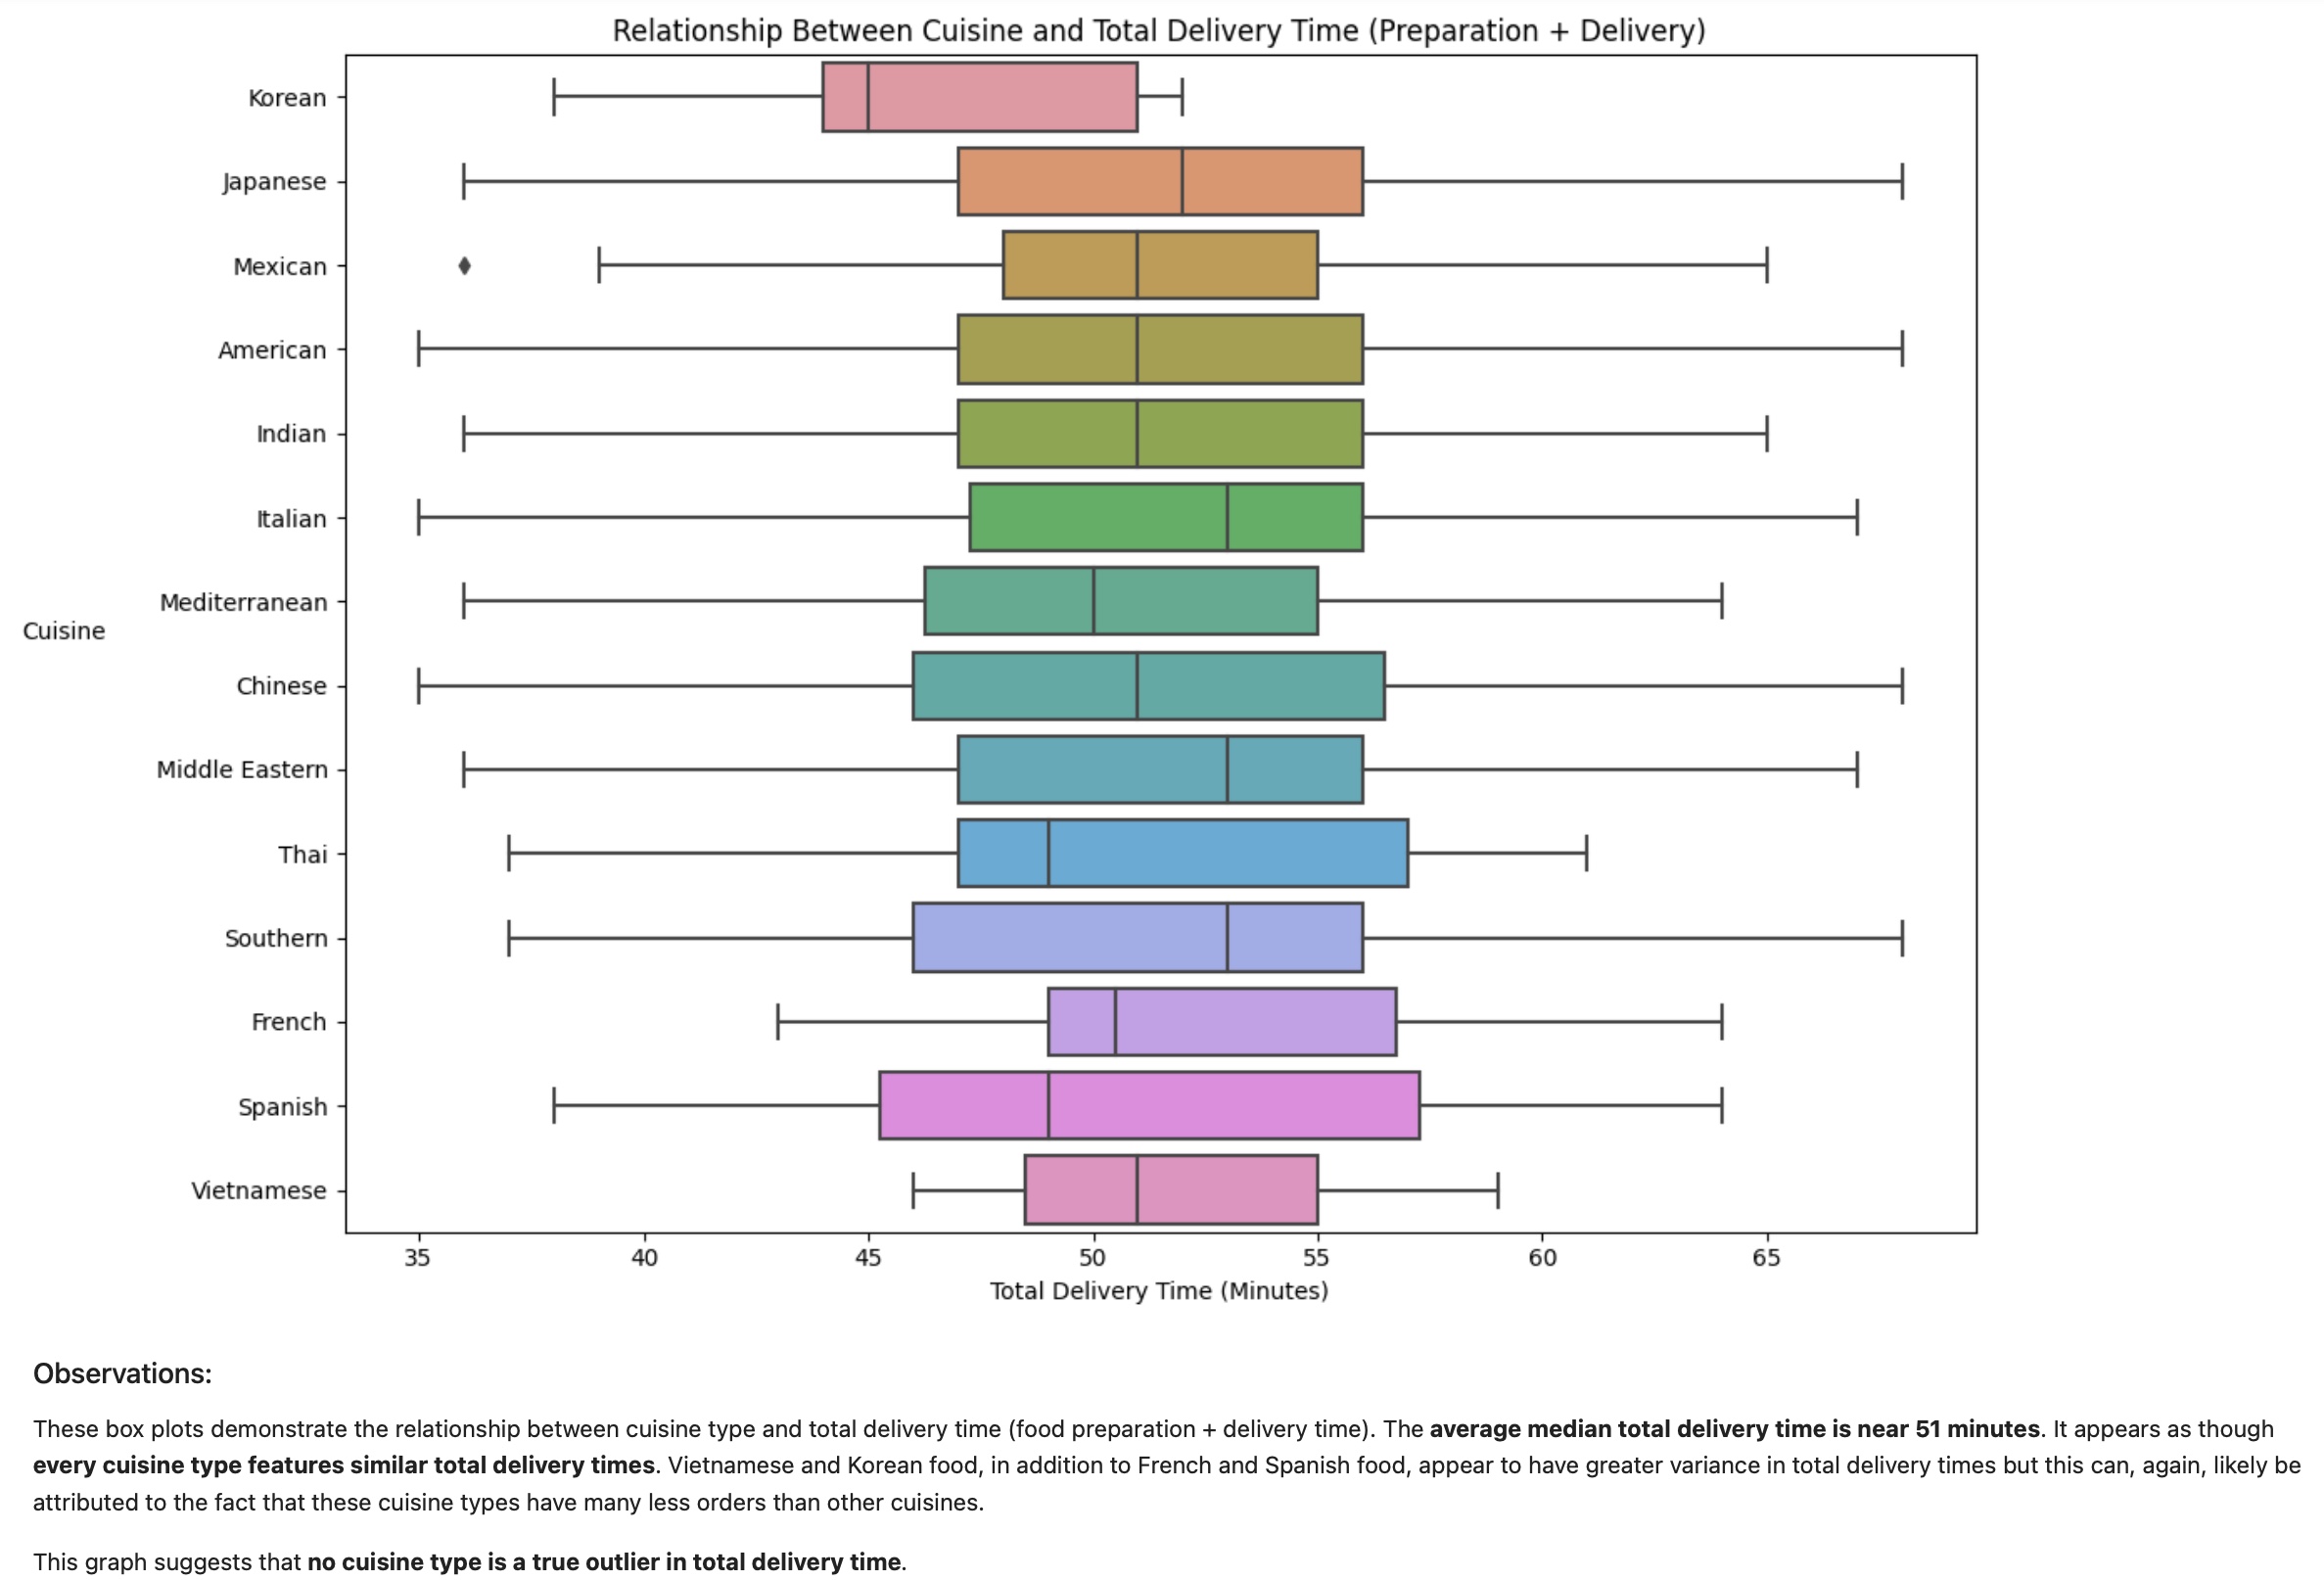
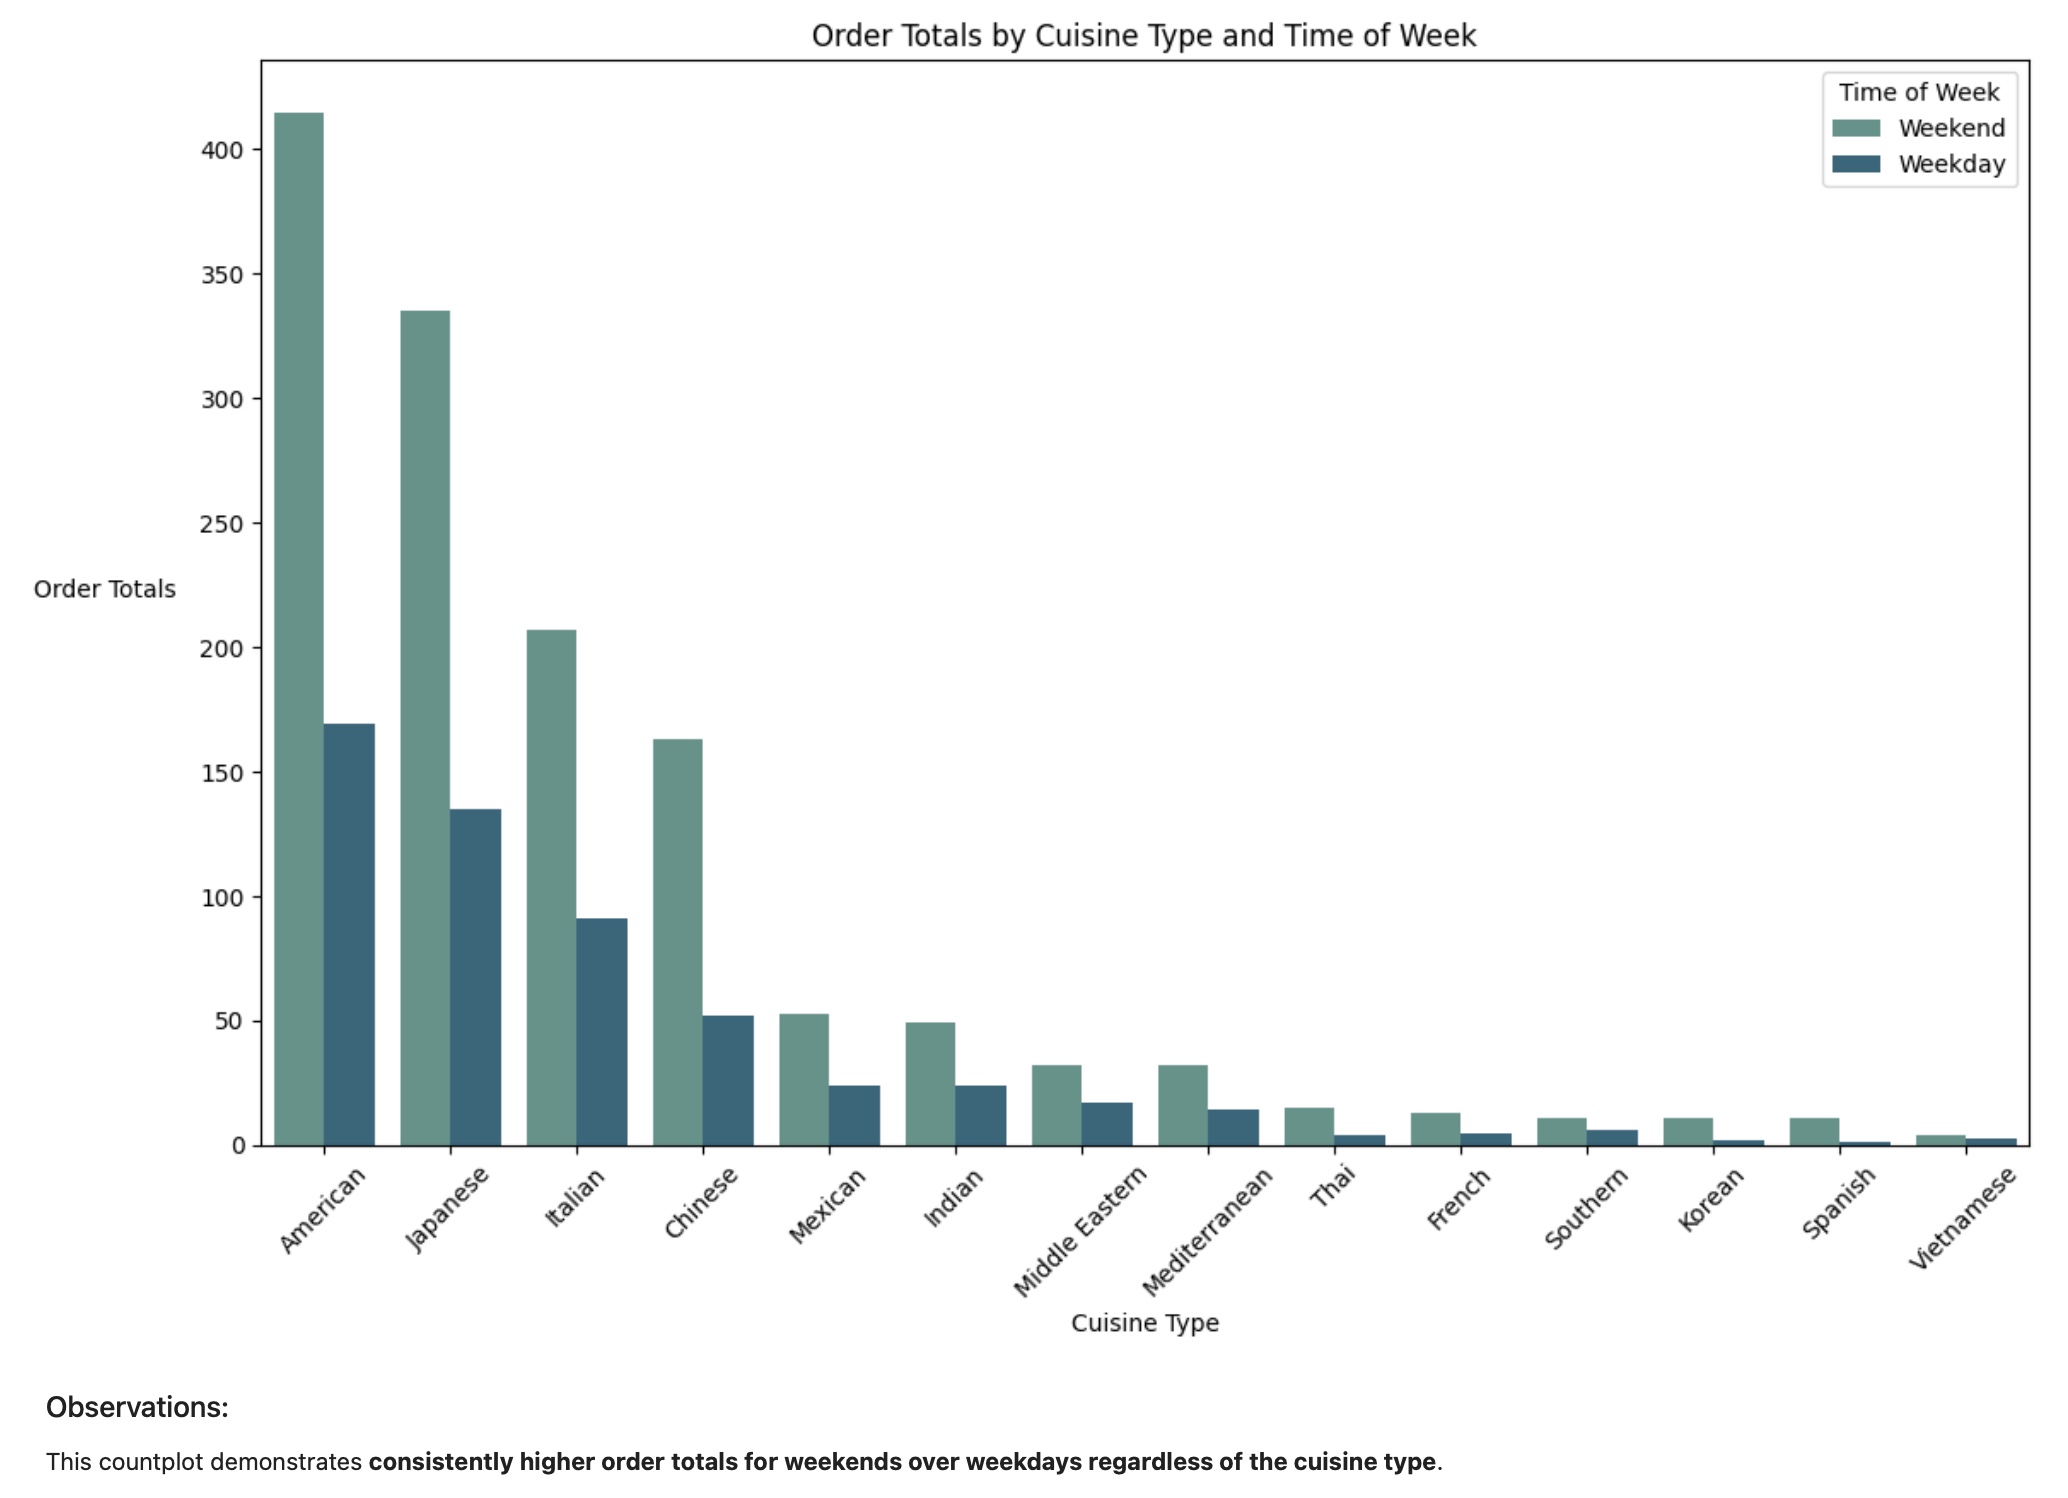
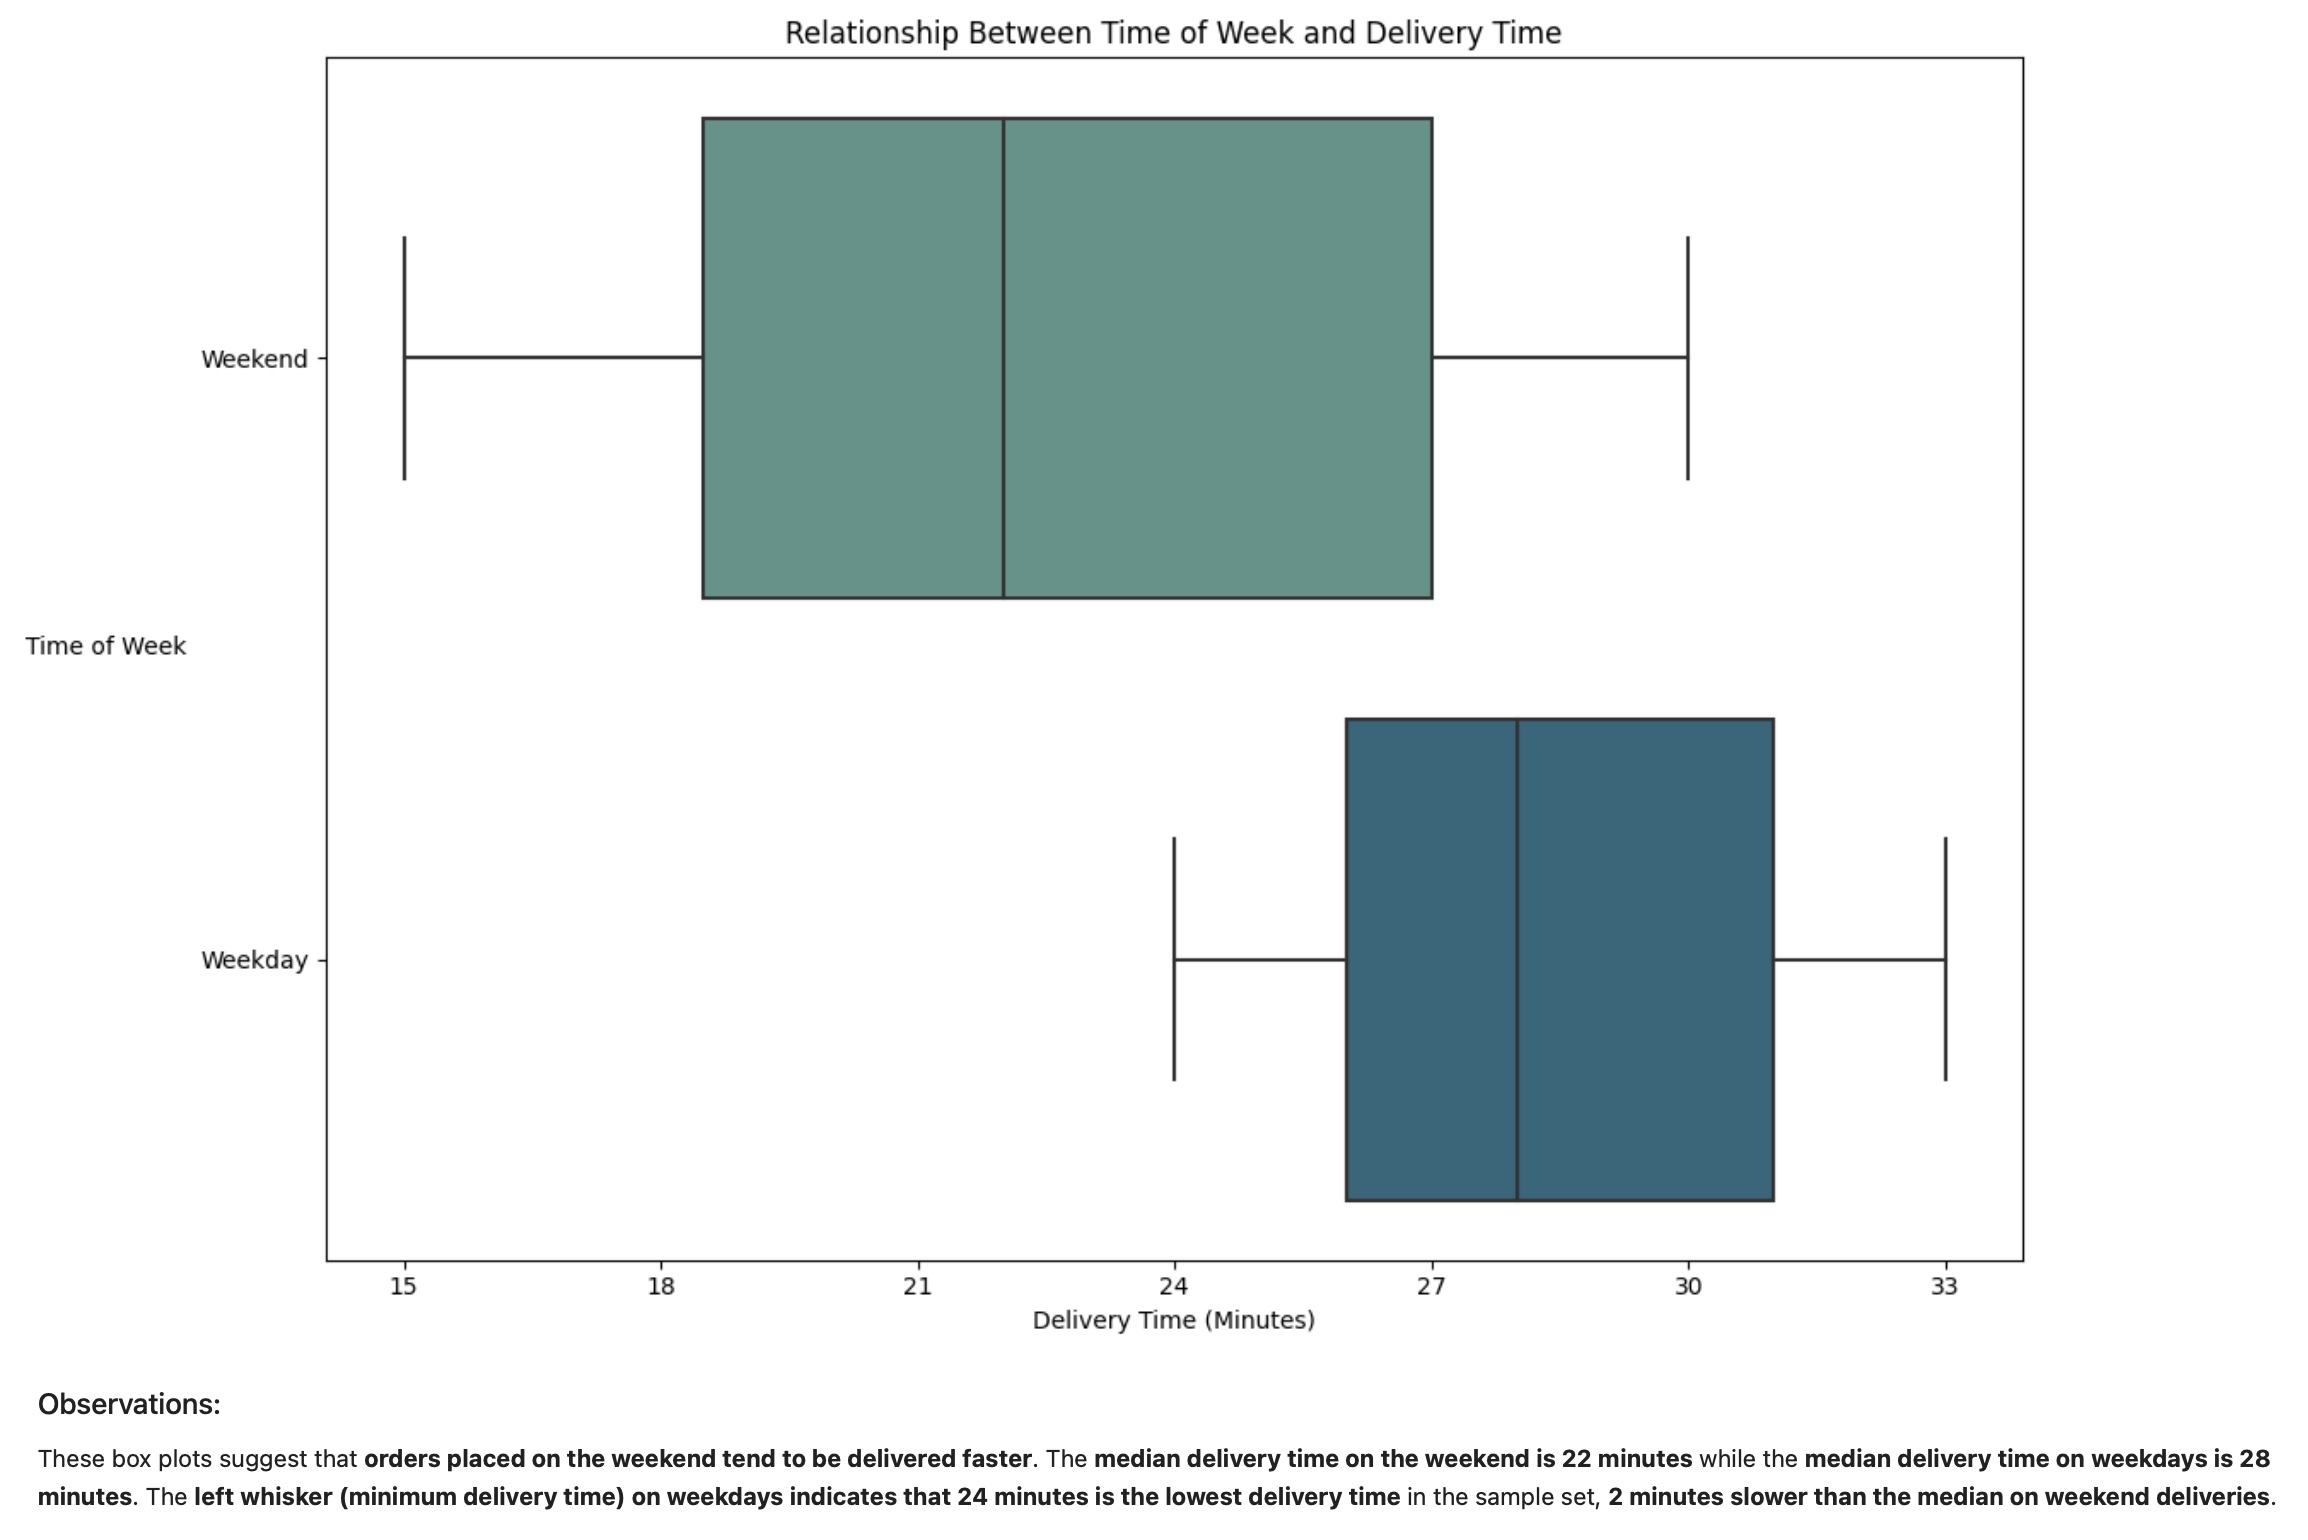
- Time Analysis: Plotted and compared order volume, delivery time, and food preparation time between weekdays and weekends to identify patterns in demand and service speed.
- Customer & Restaurant Profiling: Identified top customers by order frequency and top restaurants by both order volume and average rating.
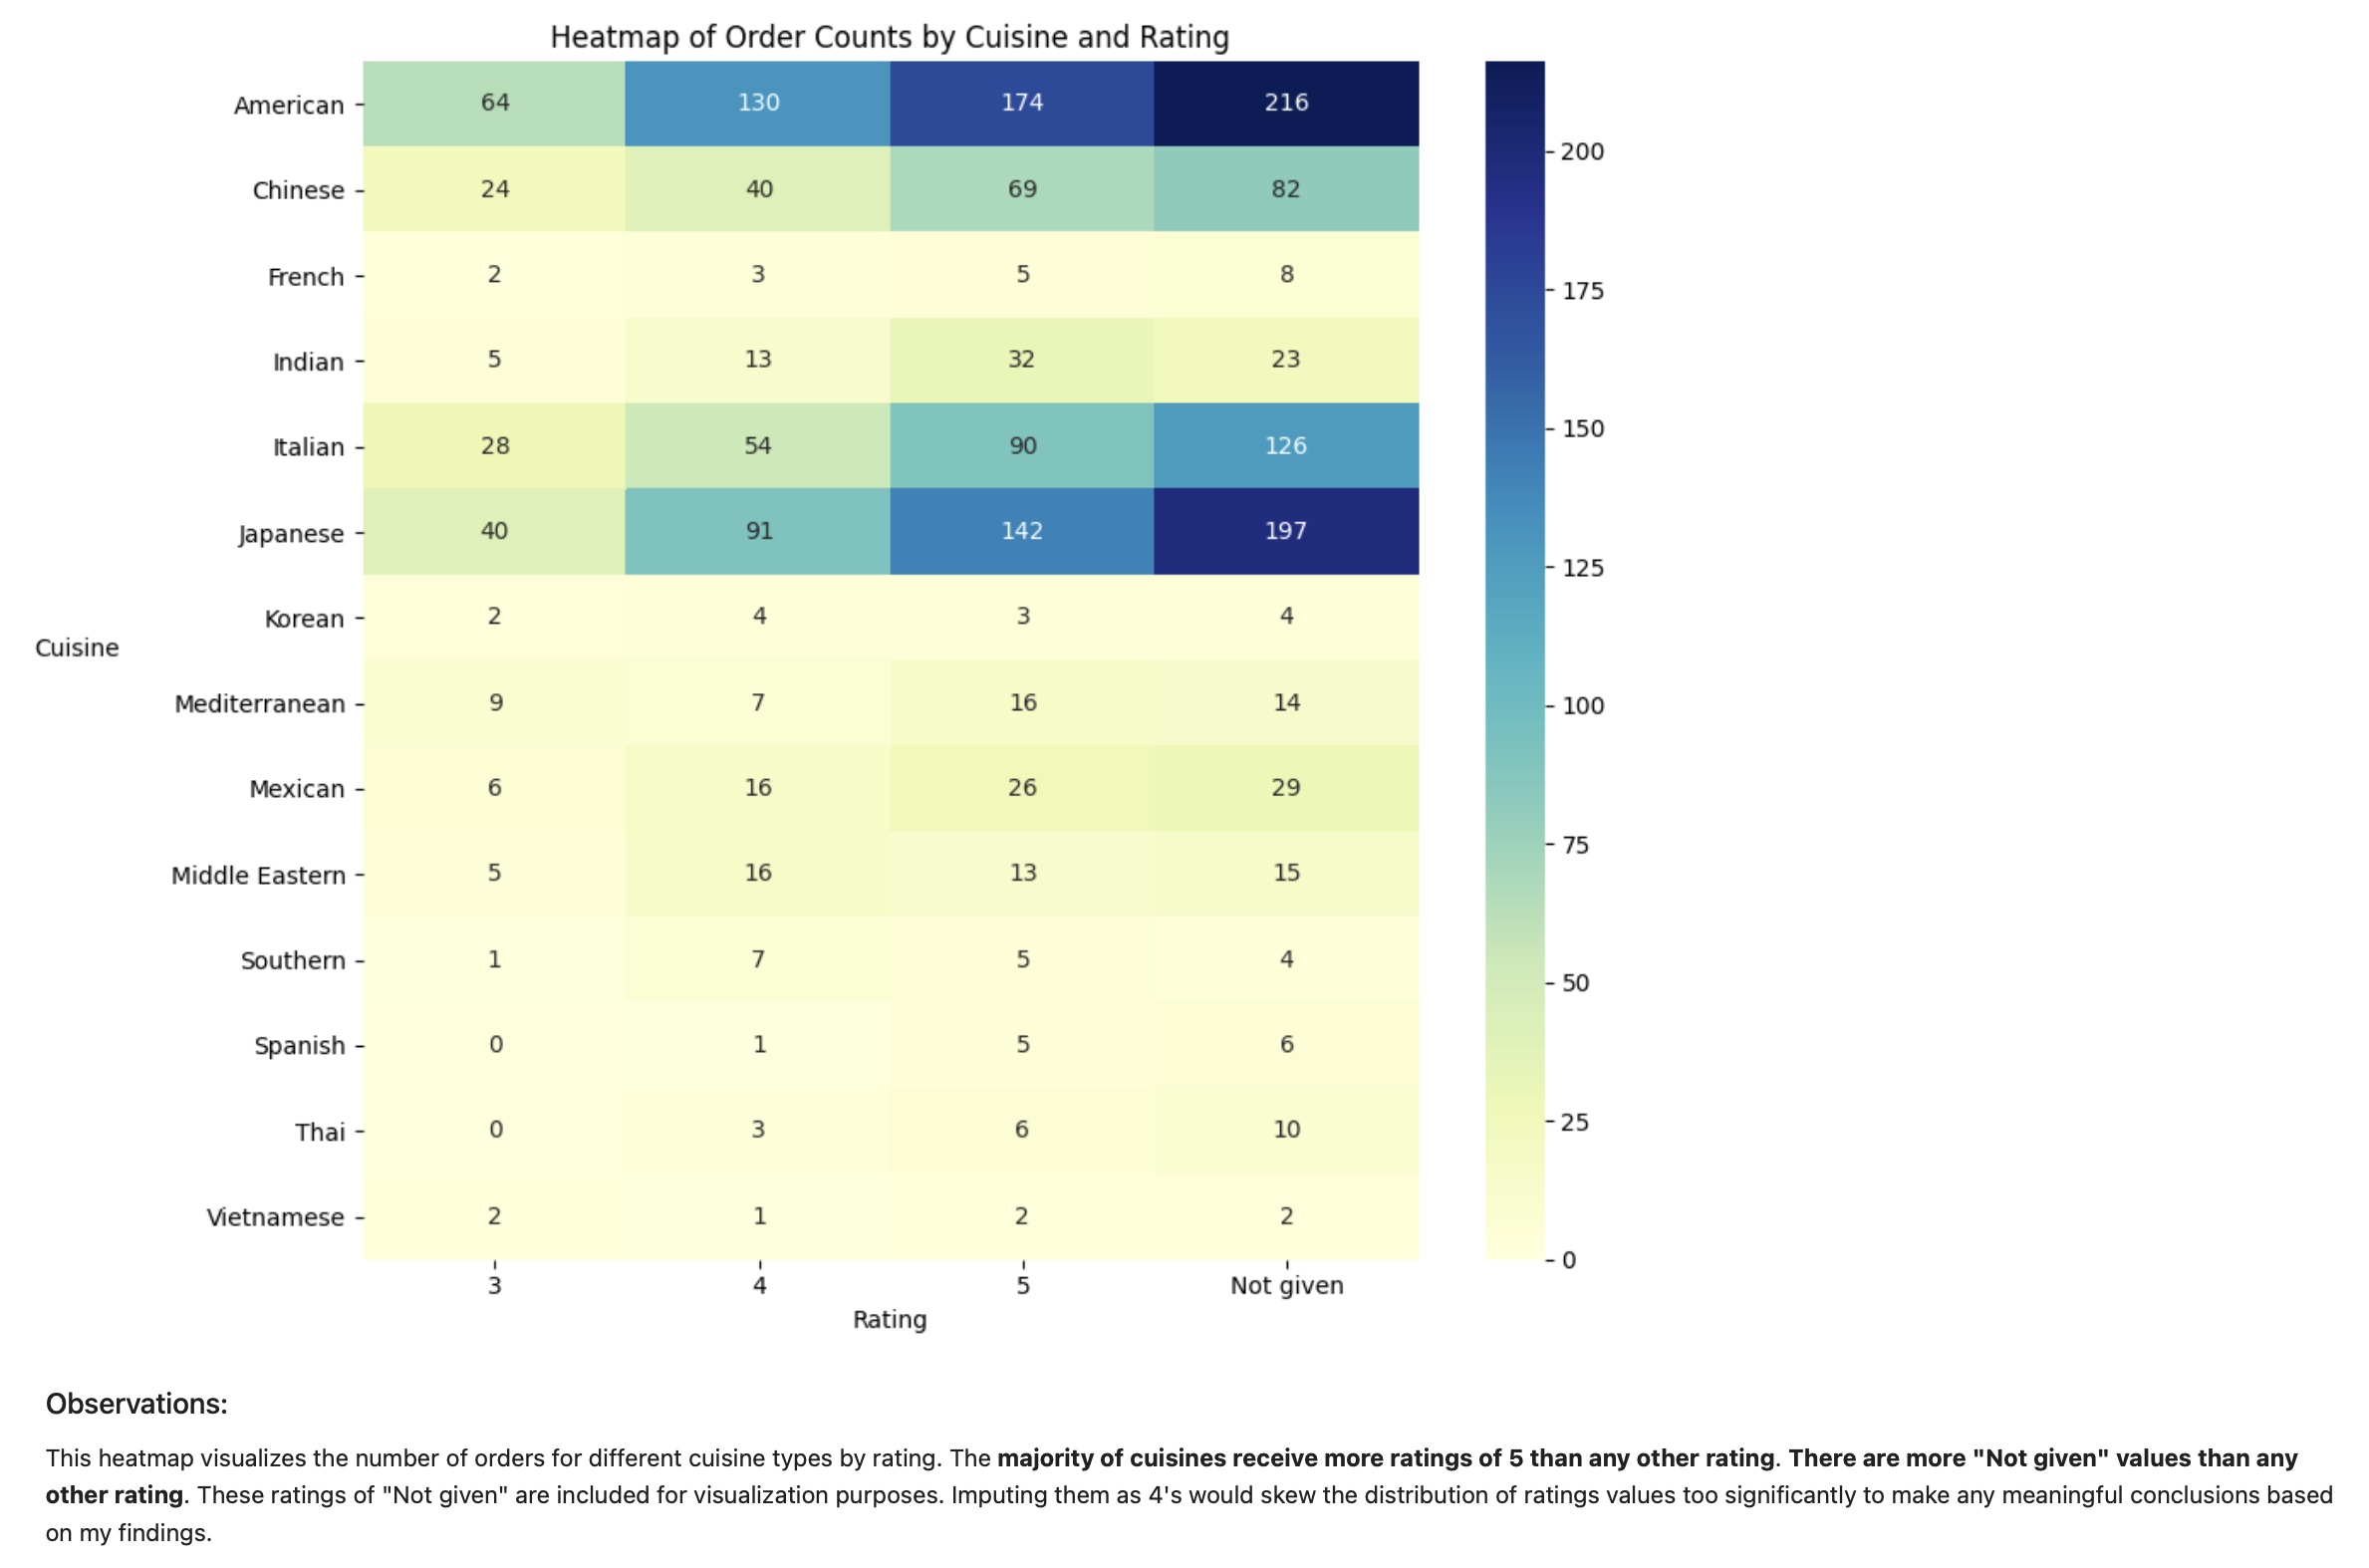
- Cost & Cuisine Analysis: Investigated the distribution of order costs and the popularity of different cuisine types through visualization.
4. Visualization & Communication:
- Created clear and effective histograms, box plots, count plots, and heatmaps to communicate key findings.
- Paired each visualization with written observations to explain the insights derived from the data.
IMPACT & BUSINESS RELEVANCE
- Operational Efficiency: Insights into delivery time differences can inform driver staffing strategies, helping to optimize allocation for weekdays versus weekends.
- Marketing & Promotions: Identifying top-rated, high-volume restaurants allows for targeted promotional partnerships. Understanding cuisine popularity helps focus marketing efforts.
- Revenue Insight: The revenue calculation provides a baseline understanding of profitability from the analyzed order types and can inform fee structure strategies.
NEXT STEPS
- Develop a strategy to increase the rate of customer ratings to gather more reliable satisfaction data.
- Incorporate more granular time data (e.g., hour of the day) to forecast peak demand windows more precisely.
- Perform customer segmentation based on order frequency and average cost to create targeted marketing campaigns and loyalty programs.